Data in the 2014 UBA Health Plan Survey is based on responses from 9,950 employers sponsoring 16,967 health plans nationwide. Results are applicable to the small to midsize market that makes up a majority of American businesses, as well as to larger employers, providing benchmarking data on a more detailed level than any other survey. To help employers benchmark their health plan costs by organization size, the chart below shows average costs in descending order.

Copyright © 2014 United Benefit Advisors, LLC. All Rights Reserved.
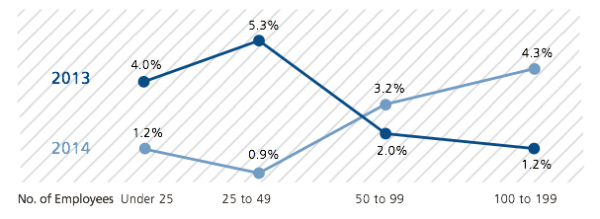
Looking at the smallest employer groups, the 2014 findings show an interesting flip in rate increase patterns. Contrast this with last year’s findings, which showed the following increases over 2012 among the same groups.

Copyright © 2014 United Benefit Advisors, LLC. All Rights Reserved.
Historically, employers with 1 to 49 employees felt the brunt of increases, which ranged from 4% to 5% or more. However, in this year’s survey results, these groups saw more modest increases of approximately 1%. Conversely, employers with 50 to 199 employees have historically had more modest increases of 1% to 2%, while this year they saw increases of approximately 3% to 4%.
The ability for small groups to “renew as is” (by grandmothering or by delaying renewals) is having a huge impact on keeping their rates level, at least at this point. Many small groups had the choice of moving to a PPACA-compliant plan or staying with the plans they had (thanks to grandmothering in some states and other delay tactics). Healthy groups tended to stay with the plans they had, which often was the most cost-effective approach. As these groups move to PPACA-compliant plans and become subject to community rating, they will likely see significant cost increases. But this year, they had a reprieve.
For more information to help you benchmark your health plan, download the 2014 UBA Health Plan Survey Executive Summary or contact a local UBA Partner for a customized benchmarking report.


